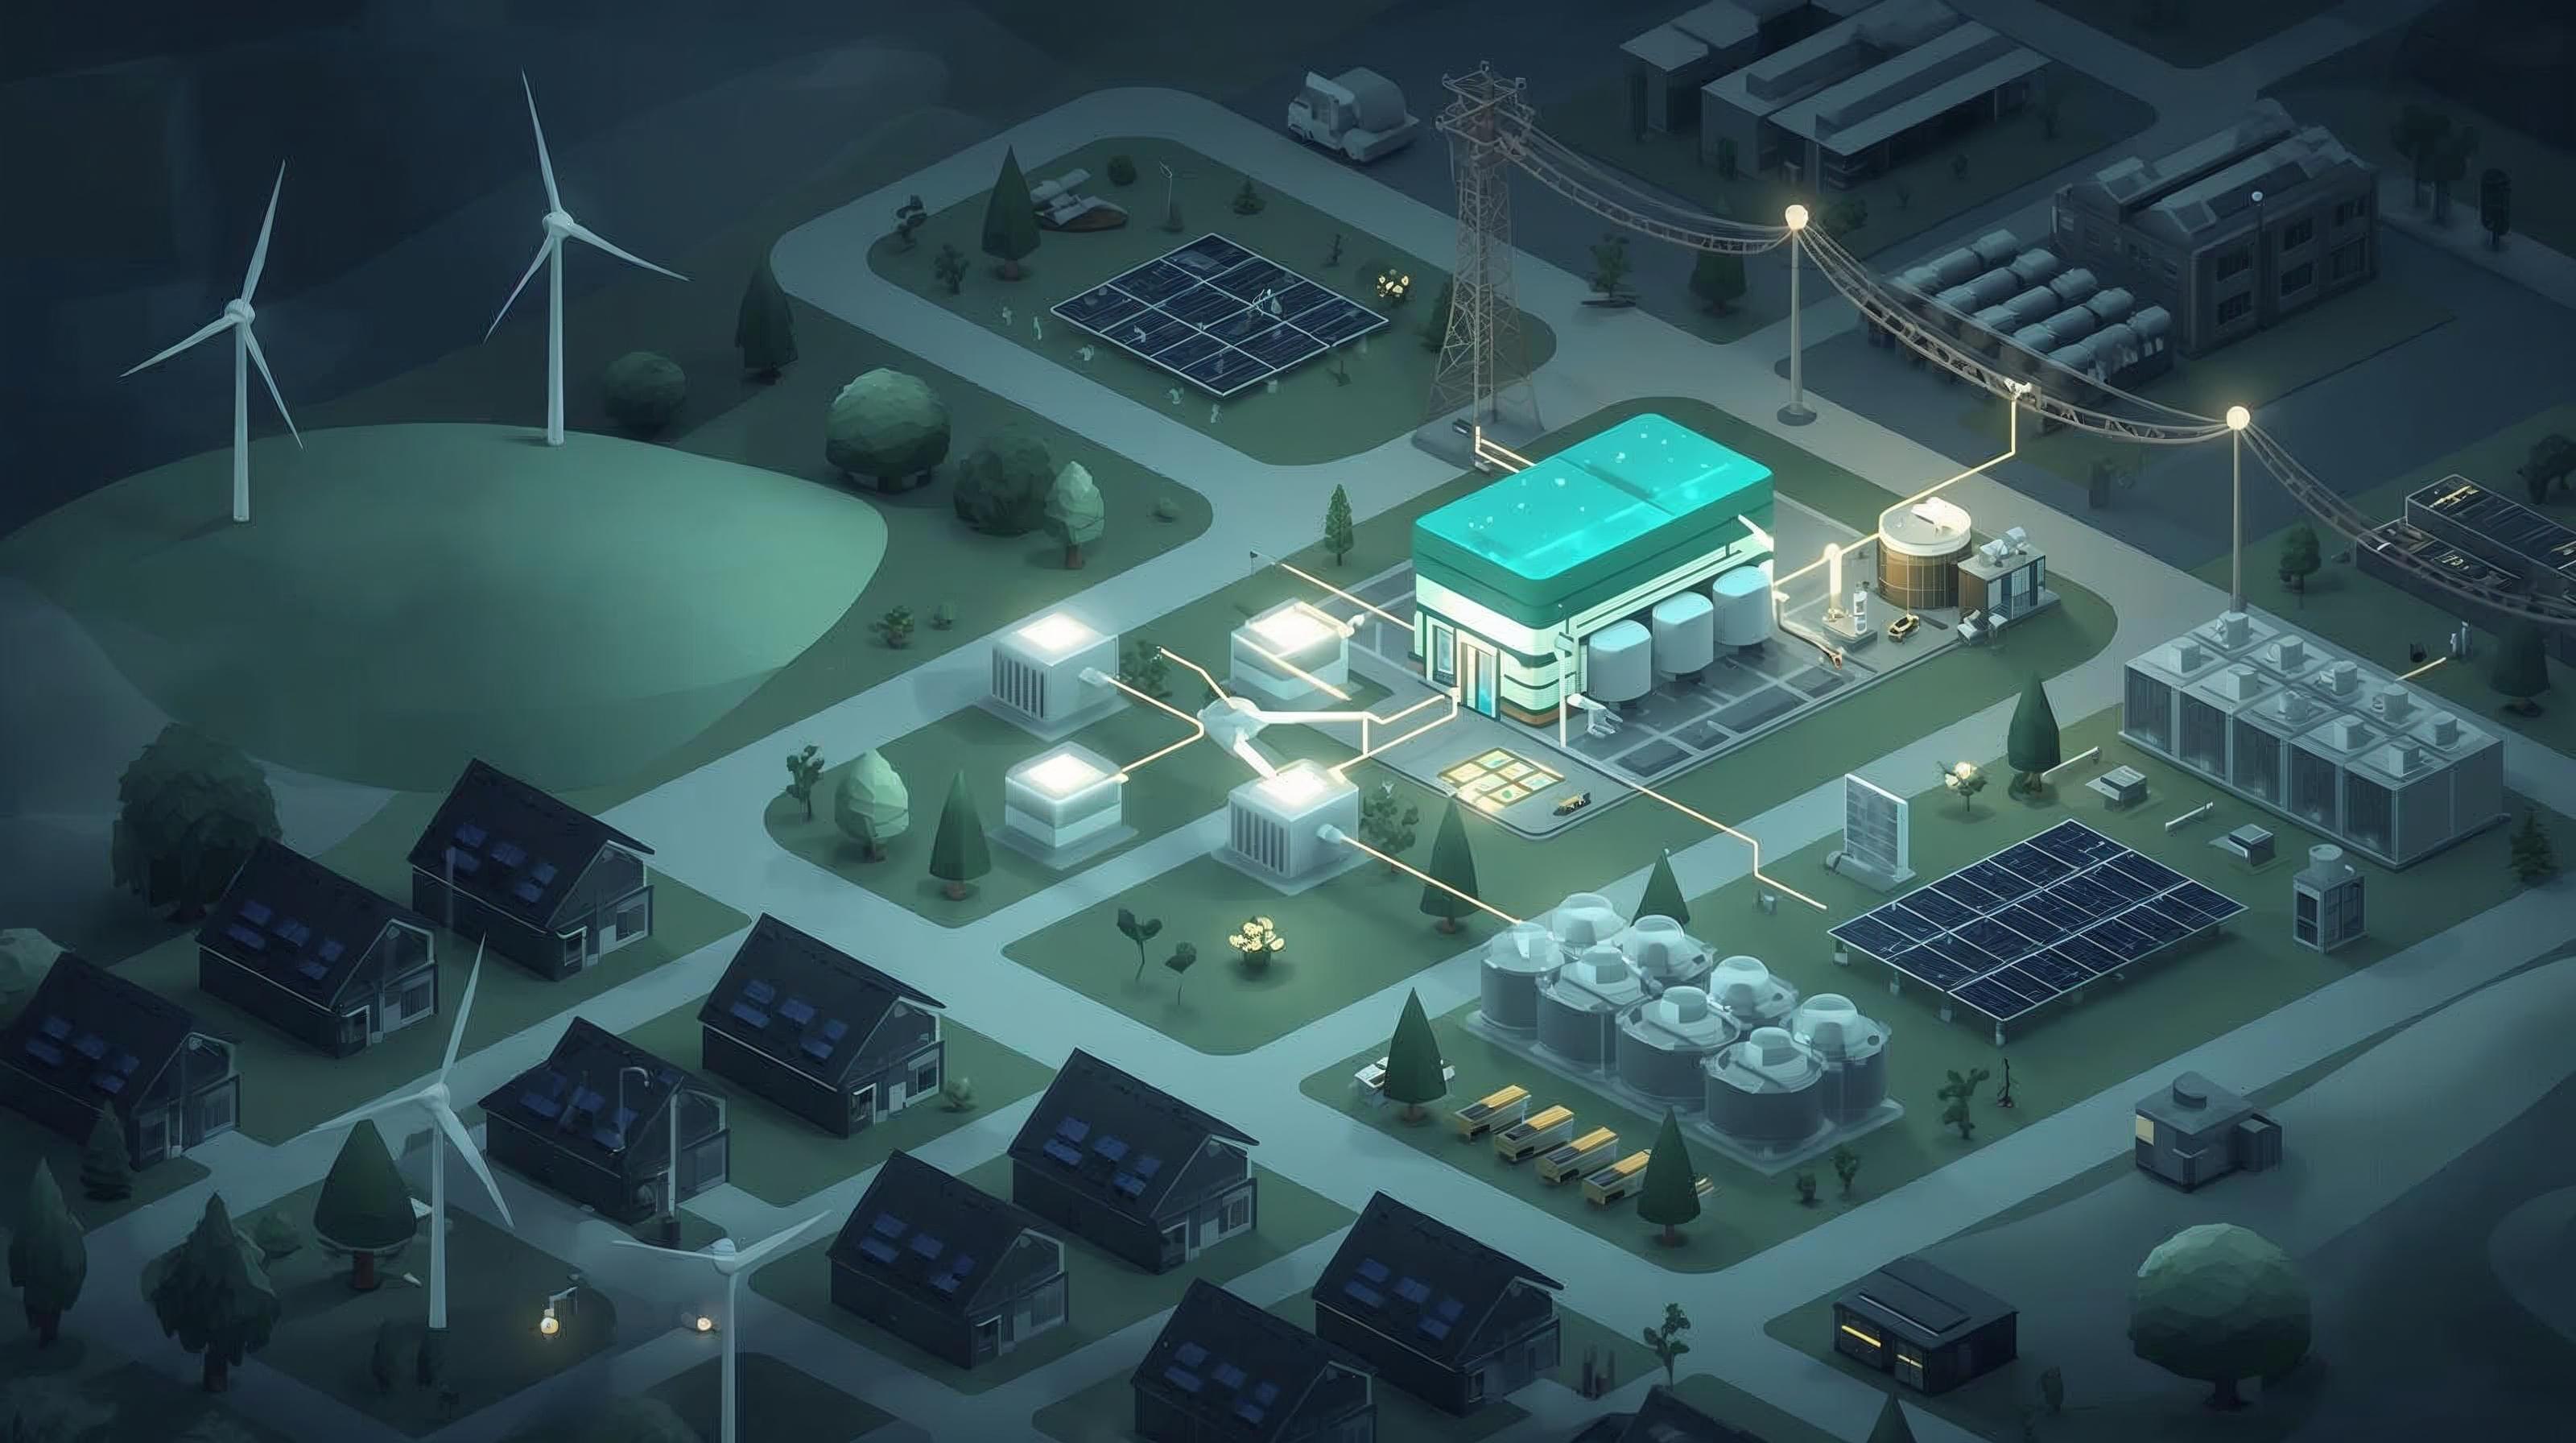
Next-Gen IIoT & Digitalization
Real-time Visualization & AI Analytics
Demo Live Statistics
🏠
Residential Solar
1,080 Homes • 10 Districts
LIVE
--
Generation (kW)
--
Consumption (kW)
--
Savings (₹)
--
Online Homes
☀️
Industrial Solar
3 Plants • 92 Inverters
LIVE
--
Power (MW)
--
Capacity Factor
--
Efficiency (%)
--
Today (MWh)
🌪️
Wind Power
3 Farms • 30 Turbines
LIVE
--
Power (MW)
--
Wind (m/s)
--
Online
--
Today (MWh)
⚙️
Process Industry
5 Lines • 50 Meters
LIVE
--
Health (%)
--
Power Factor
--
Power (MW)
--
Meters Online
Platform Features
📡
Real-Time
📊
Time-Series
🤖
AI Chatbot
🚨
Anomaly Detection
📈
Trends/Charts
🔧
Predictive Analytics
📱
Responsive
🔔
Alerts
📋
Reports
🗺️
Geo Maps
🔐
Secure
⚡
Fast
Available Demos
🏠
Residential Solar
1,080 homes • 10 districts • 2 states
- ✓ Household energy tracking
- ✓ State & district aggregation
- ✓ Grid export monitoring
- ✓ Subsidy calculation
- ✓ Performance analytics
Launch Demo →
☀️
Industrial Solar
3 plants • 92 inverters • 275 MW
- ✓ Plant-level SCADA
- ✓ Inverter performance
- ✓ Irradiance correlation
- ✓ Energy yield analysis
- ✓ Equipment health
Launch Demo →
🌪️
Wind Power
3 farms • 30 turbines • 60 MW
- ✓ Real-time turbine monitoring
- ✓ Power generation analytics
- ✓ Wind speed & direction
- ✓ Fault detection & alerts
- ✓ Nacelle orientation
Launch Demo →
⚙️
Process Industry
50 meters • 5 lines • Real-time
- ✓ Multi-line monitoring
- ✓ Temperature & pressure
- ✓ Flow rate tracking
- ✓ Energy consumption
- ✓ Process optimization
Launch Demo →
Technology Stack
🐍
Python
🌐
Django
📊
InfluxDB
🔴
Node-RED
📈
Chart.js
🎨
Tailwind
🦙
Ollama
⚡
WebSocket
🗄️
PostgreSQL
🐳
Docker
🔒
REST API
CDF